CA3 All twelve use casesContact
Satellite · NASA and IBM Prithvi-100M

NASA and IBM's crop model learned Europe in six days. And kept the United States.

The released Prithvi-100M crop classification model learned one new European region a day, with CA3 deciding what it learned. NASA's original model stays exactly as released.
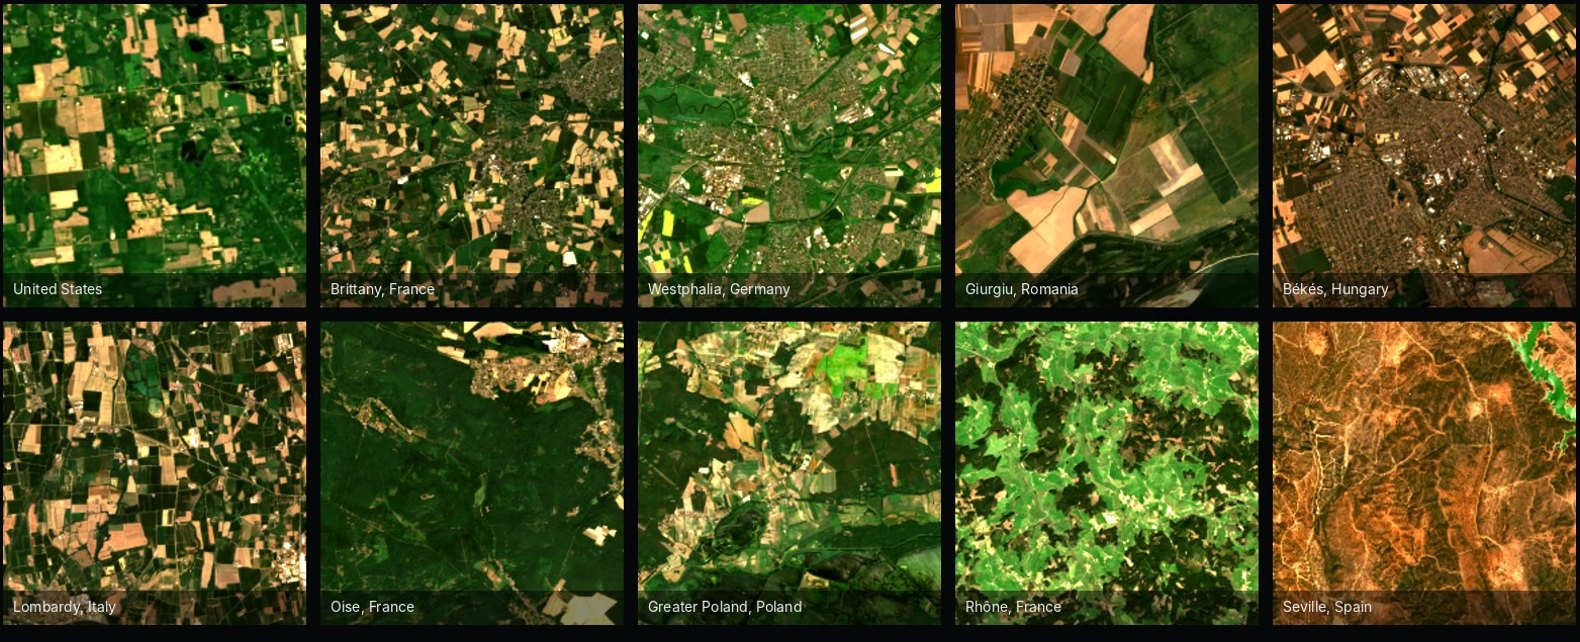
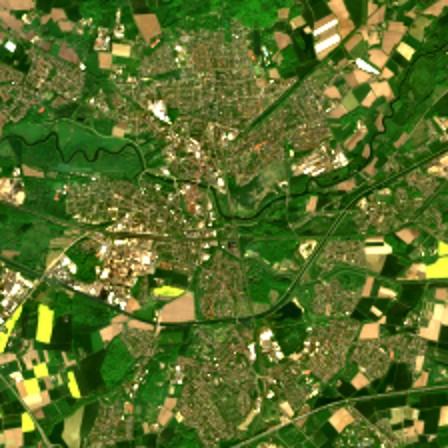
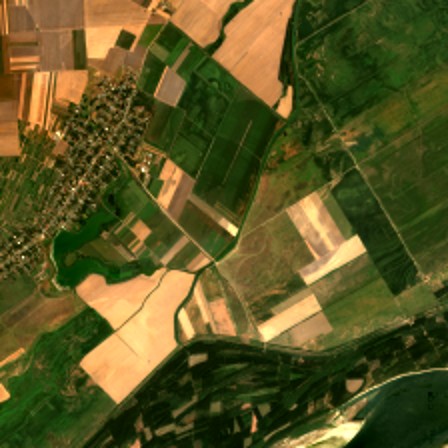
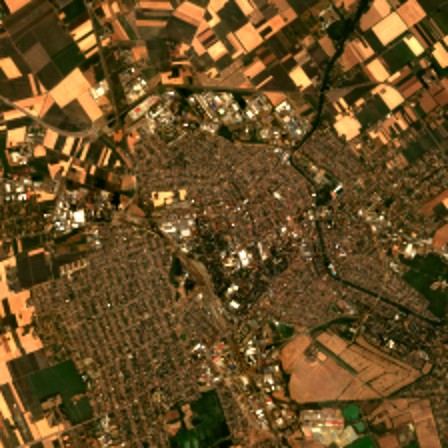
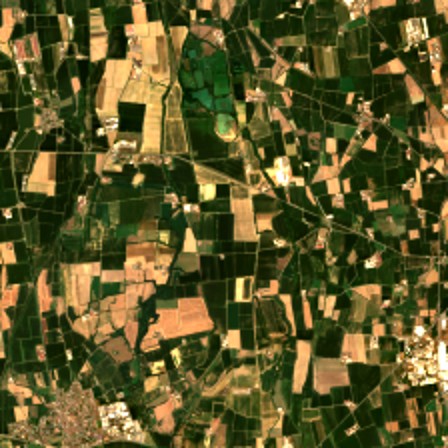
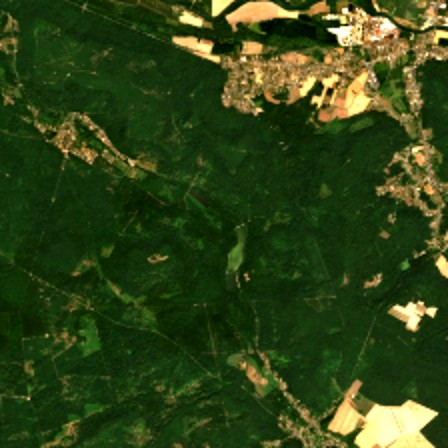
True-colour satellite tiles of farmland in the United States and nine European sites, 2022
Europe, six regions+43.2points; ordinary fine-tuning +37.8
United States60.6 → 60.1Ordinary fine-tuning: 33.2
Bad-sensor images21 of 21stopped before they reached the model
A provider leaves33 minerased, as if never seen
Learns

Six European regions, one a day.

Overall accuracy on held-out fields of each region, before and after six days with CA3.
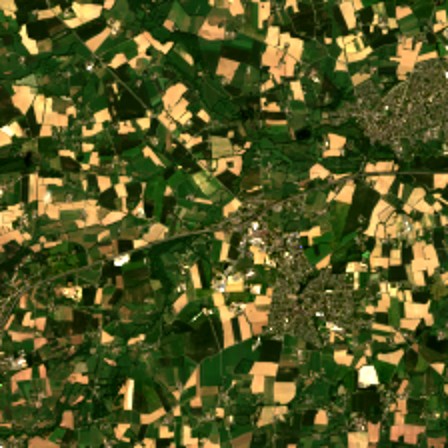
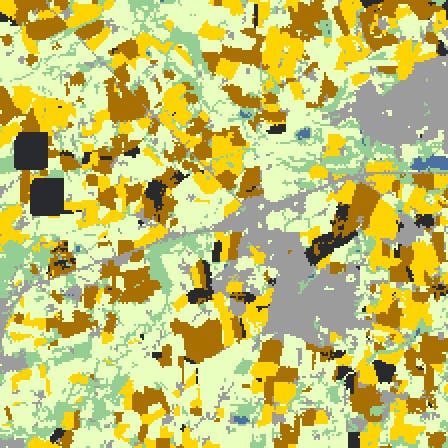
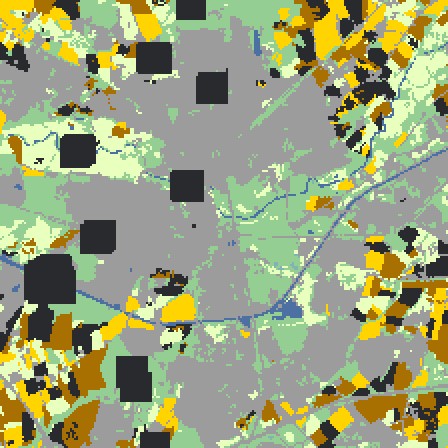
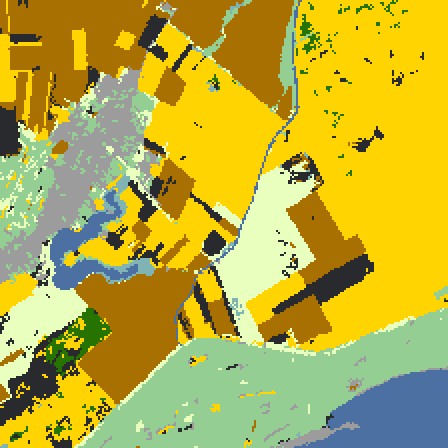
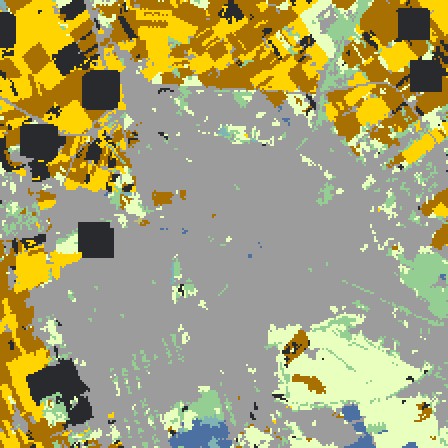
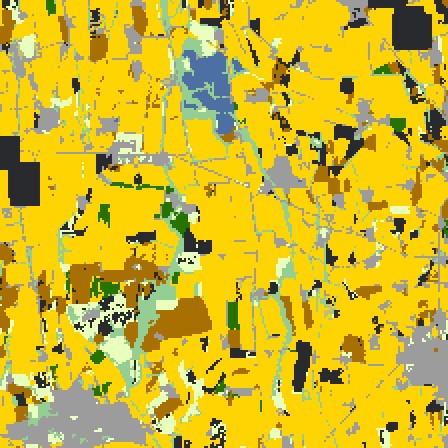
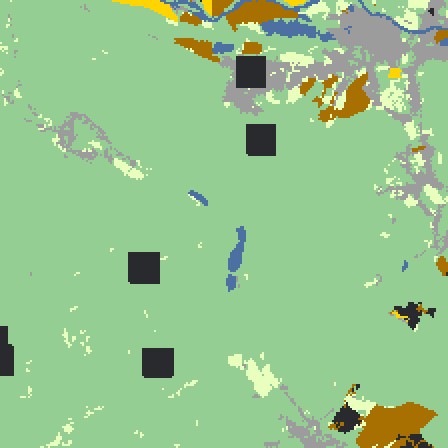
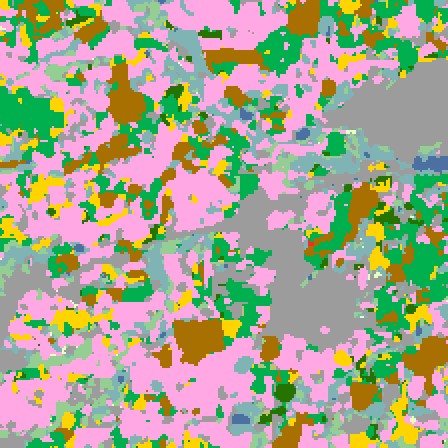
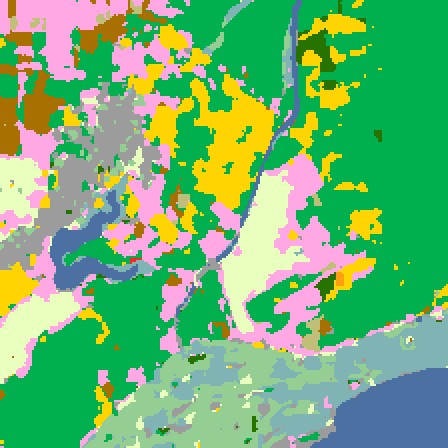
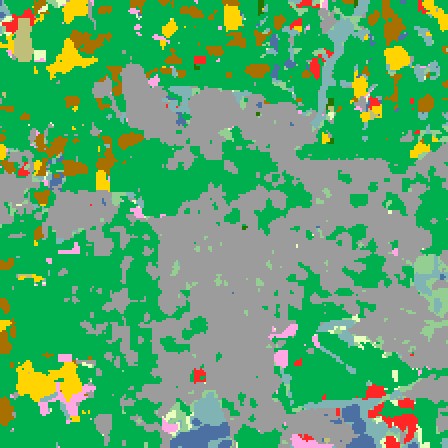
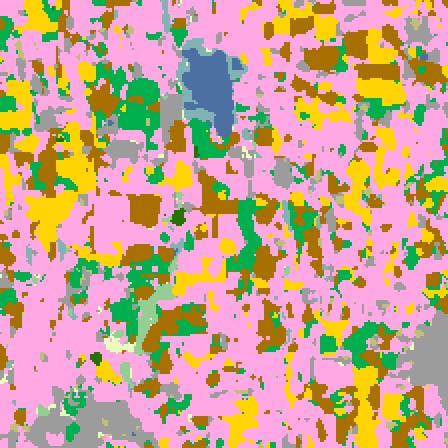
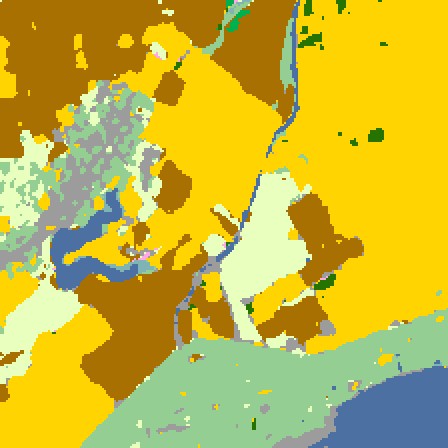
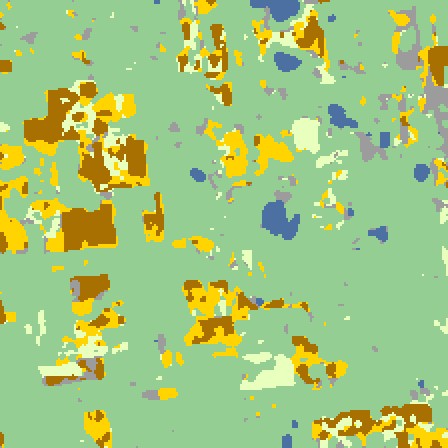
BrittanyFranceWestphaliaGermanyGiurgiuRomaniaBékésHungaryLombardyItalyOiseFranceTrue colourTrue colour, BrittanyTrue colour, WestphaliaTrue colour, GiurgiuTrue colour, BékésTrue colour, LombardyTrue colour, OiseReferenceReference, BrittanyReference, WestphaliaReference, GiurgiuReference, BékésReference, LombardyReference, OiseReleased modelReleased model, BrittanyReleased model, WestphaliaReleased model, GiurgiuReleased model, BékésReleased model, LombardyReleased model, OiseWith CA3, day 6With CA3, day 6, BrittanyWith CA3, day 6, WestphaliaWith CA3, day 6, GiurgiuWith CA3, day 6, BékésWith CA3, day 6, LombardyWith CA3, day 6, OiseAccuracy26% → 69%36% → 68%45% → 83%27% → 81%27% → 72%39% → 85%
Natural vegetationForestCornSoybeansWetlandsDeveloped or barrenOpen waterWinter wheatAlfalfaFallow or idleOtherNo label
Keeps

Its home map stays as it was.

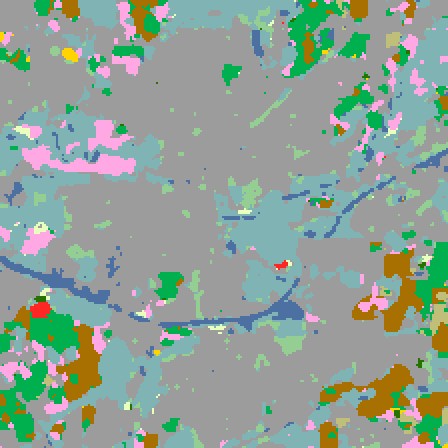
With CA3 the US validation set holds at 60. Ordinary fine-tuning learns Europe too, and loses the United States: 23 points on the first day, 33 at the end. It also forgets Europe as it goes (Brittany 79 after day 1, 51 after day 6; with CA3, 69).
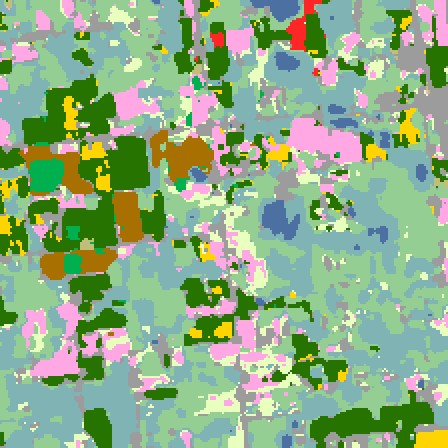
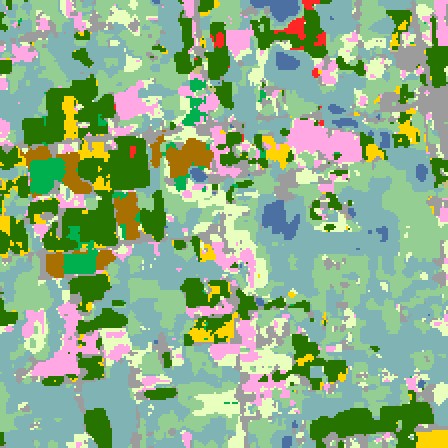
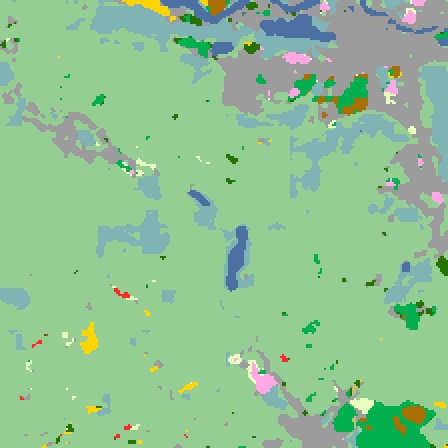
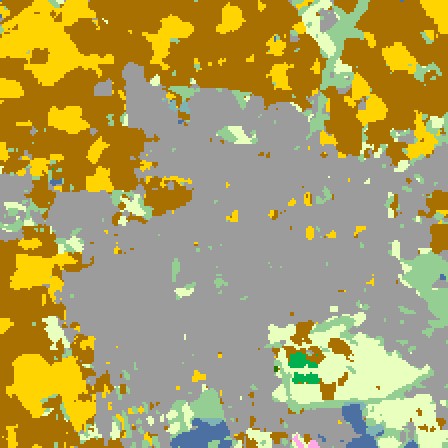
US crop map, released model
Released model61%United States, before
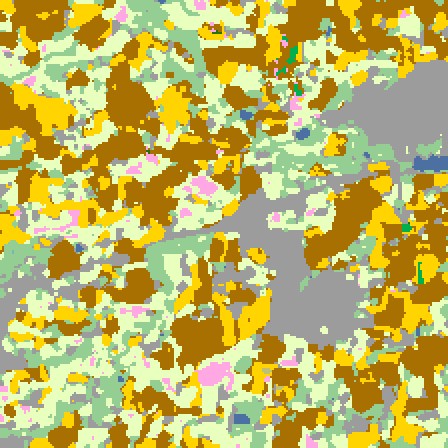
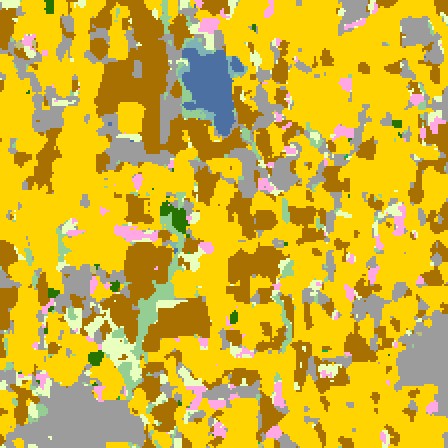
US crop map with CA3
With CA360%after six days in Europe
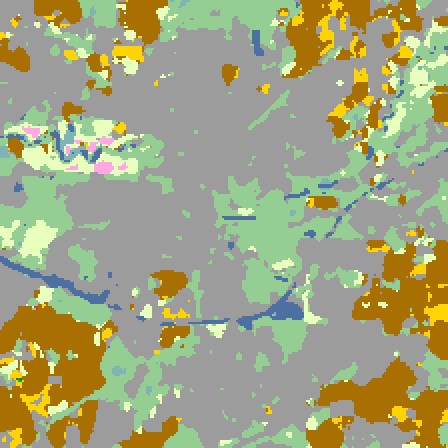
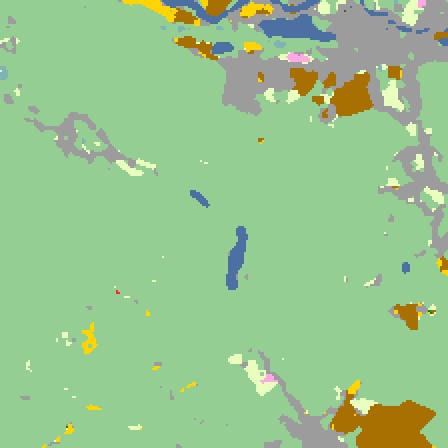
US crop map, ordinary fine-tuning
Ordinary fine-tuning33%after six days in Europe
Blocks

A miscalibrated sensor is turned away.

On day 5 a sensor sent corrupted images. CA3 stopped all of them before they reached the model; 16% of clean images were held back too.

21 of 21bad-sensor images stopped
Undonethe day the training engine failed; kept, it would have left the US at 21%
Forgets

A data provider withdraws its licence.

A licensed provider in Greater Poland contributed images on days 1 to 3, then withdrew. In 33 minutes CA3 removed what it taught, without touching NASA's model.

67.9Greater Poland after the erasure
66.8a model that never saw the provider
≤ 1.6points from that model, in every other region
Never changes

The released model is never modified.

The fingerprint of NASA and IBM's weights is the same at the start, after the erasure and at the end.

104333b9cf6677c8 · at the start
104333b9cf6677c8 · after the erasure
104333b9cf6677c8 · at the endFingerprint of the released weights
How the test was run

The test, step by step.

Six days, one European region a day, with the incidents of an operational service planted.

Days 1 to 3Brittany, Westphalia, GiurgiuPlus images from a licensed provider in Greater Poland.
Day 4BékésA faulty training engine.Day rolled back; its images wait
Day 5Lombardy, and Békés againA miscalibrated sensor.21 of 21 images stopped
Day 6OiseThe last region.
AfterwardsThe licence is withdrawnGreater Poland's provider comes out.Removed in 33 min

Compared with ordinary fine-tuning: the whole model retrained on the same six days with everything received, no CA3. Overall accuracy on the held-out eastern quarter of each region's tile, on two sites never taught and on the official US validation set (771 tiles). Six pass criteria registered before the run; all six met.

Overall accuracyEurope, six regionsUnited StatesBrittany, end
Released model3360.626
Ordinary fine-tuning7133.251
With CA37660.169
Europe rose from 33 to 76 on average with CA3, more than with ordinary fine-tuning (71).
The United States stayed at 60; fine-tuning ended at 33.
After the erasure, Greater Poland sits 1.1 points from a model that never saw the provider.

Test it on your model.

A test on your own regions and seasons: your team sets the protocol and scores the predictions with its own code.

ContactAll twelve use cases

Model and data

  • Prithvi-100M multi-temporal crop classification (NASA and IBM, Apache-2.0), run with its own code, head and normalisation.
  • Imagery: NASA HLS 2022. Labels: JRC EUCROPMAP 2022 (Europe), USDA CDL (United States).
  • Maps: one showcase tile per region.

Sources

  • NASA Harmonized Landsat and Sentinel-2 (HLS), 2022.
  • Joint Research Centre, EUCROPMAP 2022.
  • USDA National Agricultural Statistics Service, Cropland Data Layer.

Limits

  • One pre-registered run, 31 Oct 2026, about 2 hours on one GPU.
  • The released Prithvi-100M model, not a newer version.
  • EUCROPMAP is a map, not field data.
  • The two sites never taught barely improve (+0.5 and +5.6 points): CA3 learns what it is shown.
  • 16% of clean images were also set aside.

Results from recorded, pre-registered tests. The mechanism is not shown. Model and dataset names are for identification only. Not produced or endorsed by NASA or IBM. CA3 is developed by Alberto Acedo, PhD, at Biome Makers Inc.